The challenge
Data fragmentation. Operational data and KPIs were scattered across disparate Excel files, emails and subsystems — making aggregation slow, error-prone and stale by the time anyone looked.
Lack of visibility. Leadership lacked a real-time holistic overview to make prompt strategic decisions. Decision-making rhythm was constrained by reporting latency.
Our approach
Centralised data
We developed NetBI to consolidate enterprise data into a single source of truth — pulling from existing subsystems via standard connectors and a custom ingestion layer.
Automation
The reporting import/export workflows that previously consumed analyst hours each week are now fully automated — scheduled, monitored and self-healing.
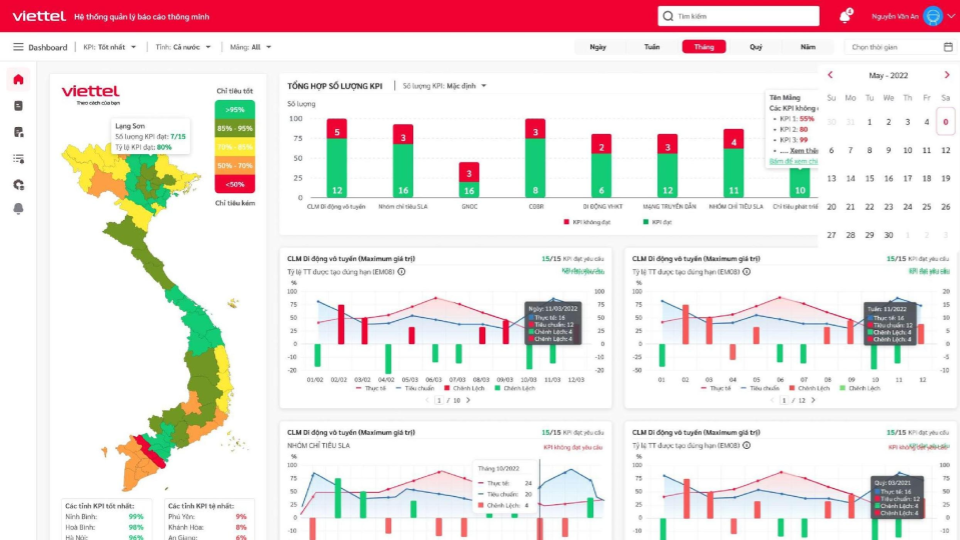
Visual dashboards
Intuitive charts and graphs with granular role-based access control for subordinate units — leadership sees the whole picture; unit heads see their slice.
The impact
NetBI cut manual reporting time by 90% — empowering management with instant visibility into business health and enabling timely strategic adjustments that the old reporting rhythm couldn't support.
Drowning in dashboards but starving for insight?
We've built BI systems that the C-suite actually opens. Tell us what's on yours.